Holistic Measurement
Brand health + advertising impact + market dynamics — tracked simultaneously in a single programme.
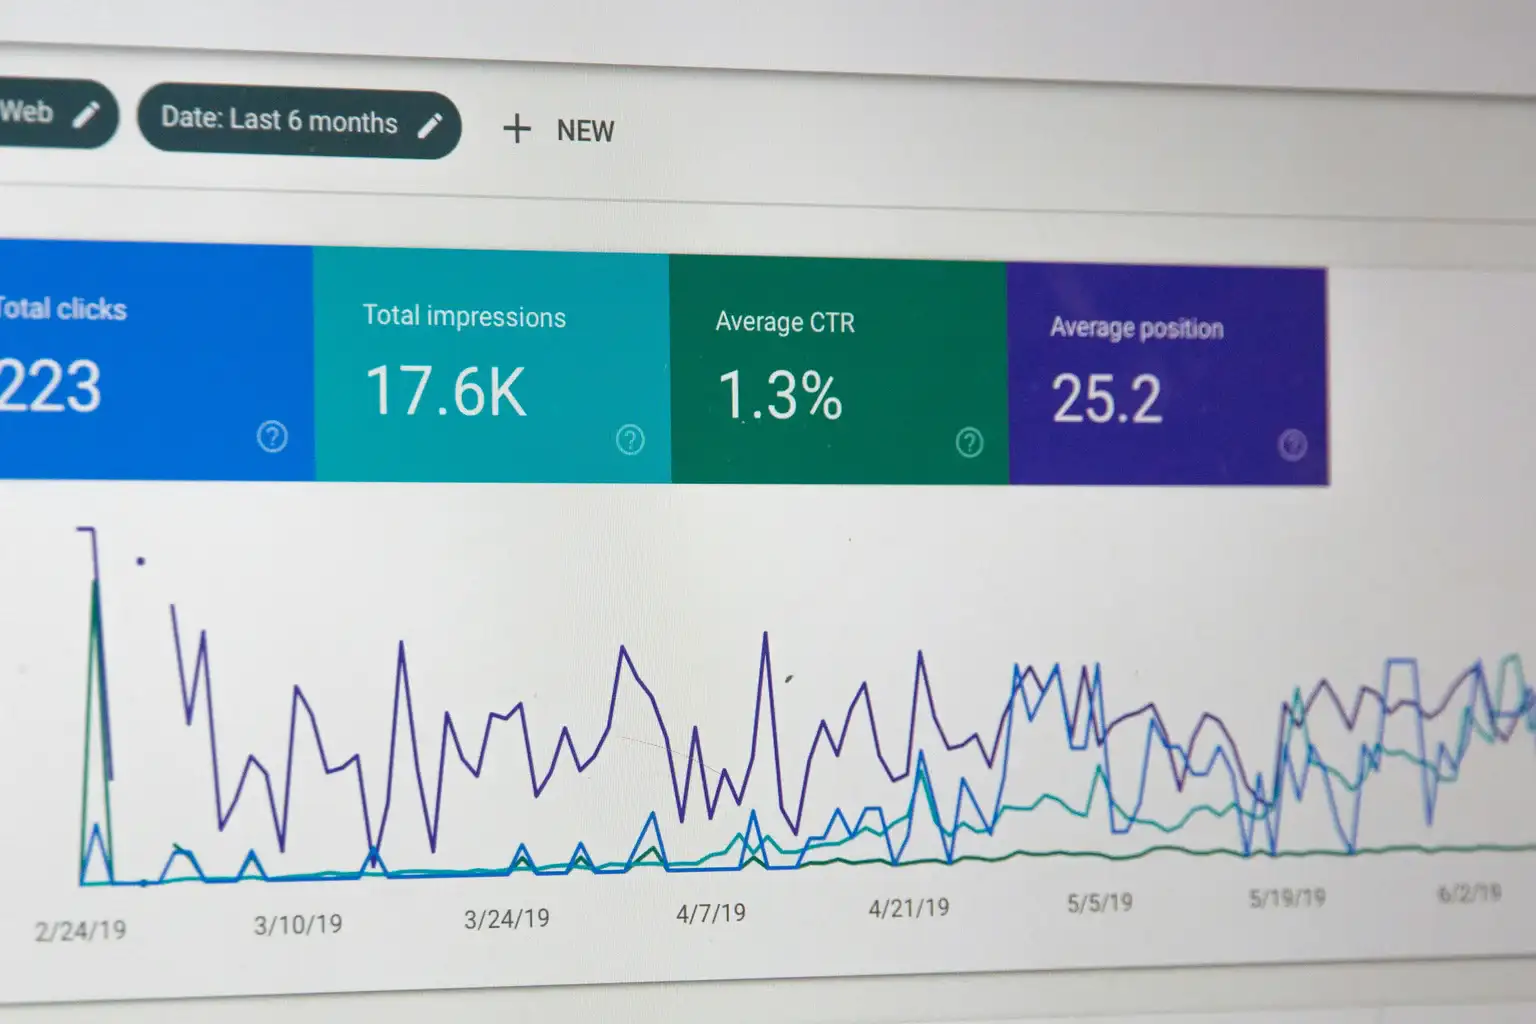
Continuous measurement of brand health, campaign impact, and market dynamics over time
A single measurement tells you where you are. Tracking tells you where you’re heading. Tracking studies measure the same brand, advertising, and market metrics at regular intervals (monthly, quarterly, or continuously), revealing trends, impact of marketing activities, and competitive shifts over time. They are the heartbeat monitor of your brand — and the accountability system for your marketing investment.
What we track. Brand health: awareness (spontaneous + aided), consideration, preference, usage, loyalty, and NPS. Advertising: campaign recall, message takeaway, branding, and persuasion (pre-post testing). Market dynamics: category usage, competitive brand switching, pricing perception, and channel preferences. Custom KPIs: any business-specific metric you need to monitor over time.
Wave-based vs. continuous. Wave-based tracking measures metrics at fixed intervals (e.g., quarterly), providing periodic check-ins. Continuous tracking conducts a steady stream of interviews (e.g., N=100/week), enabling rolling averages and real-time trend detection. We recommend wave-based for strategic brand tracking and continuous for campaign effectiveness monitoring.
Trend analysis and alert systems. Our tracking reports include trend visualisation (quarter-by-quarter or month-by-month), statistical change detection (are shifts significant or within noise?), competitive context (your trends vs. competitors’), and alert triggers (automated notifications when key metrics cross thresholds).
The investment case. Without tracking, your marketing is blind — you launch campaigns, invest in brand building, and adjust pricing without knowing the impact until quarterly sales data arrives (too late to course-correct). Tracking provides continuous feedback that enables real-time optimisation.
Sources: ESOMAR, Millward Brown (Kantar), Fieldstat tracking practice
| Design | Frequency | Sample per Wave | Best For |
|---|---|---|---|
Quarterly waves |
Every 3 months |
N=300–500 |
Strategic brand health monitoring |
Monthly waves |
Every month |
N=200–400 |
Active campaign tracking, competitive monitoring |
Continuous |
Ongoing (weekly) |
N=100–200/week |
Real-time campaign impact, fast-moving categories |
Annual benchmark |
Once per year |
N=500–1,000 |
Deep-dive with trend context |
How does brand awareness change in subsequent quarters?
Did our campaign shift key brand equity indicators?
How are market shares evolving in our category?
Is the brand image changing in line with strategic assumptions?
How does our brand funnel perform compared to competitors?
Brand health + advertising impact + market dynamics — tracked simultaneously in a single programme.
Automated notifications when key metrics cross predefined thresholds — so you can react immediately.
We distinguish real shifts from statistical noise — so your decisions are based on genuine change.
Your brand metrics tracked alongside 2–5 competitors for continuous competitive context.
We define KPIs, measurement frequency, sample design, and reporting format.
We conduct the first wave to establish baseline levels for all tracked metrics.
We conduct regular measurement waves on consistent samples and methodology.
We analyse trends, detect statistically significant changes, and contextualise against competitive data.
Wave reports with trend charts, alert flags, and strategic implications delivered within 1 week of fieldwork.
Quarterly for strategic brand tracking. Monthly during active campaigns. Continuously for fast-moving categories.
Wave-based tracking from PLN 12,000/wave. Continuous tracking from PLN 8,000/month. Annual programmes from PLN 50,000.
Typically 2–5 competitors. Adding competitors increases questionnaire length marginally.
A tracking study measures brand health metrics (awareness, consideration, preference, usage, image) at regular intervals to detect trends, campaign effects, and competitive shifts over time.
Quarterly for most brands. Monthly during active campaigns or competitive disruption. Continuous (weekly) for large FMCG brands or real-time campaign optimisation.
N=300–500 per wave for category-level tracking. N=100–200 per week for continuous designs. Larger samples needed for sub-group analysis.
External sources and industry organizations related to this research method:
This solution is most frequently applied in the following industries: