Objective Attention Data
Eye tracking measures what respondents actually see — not what they say they see. Millisecond-precision data eliminates declaration bias entirely.
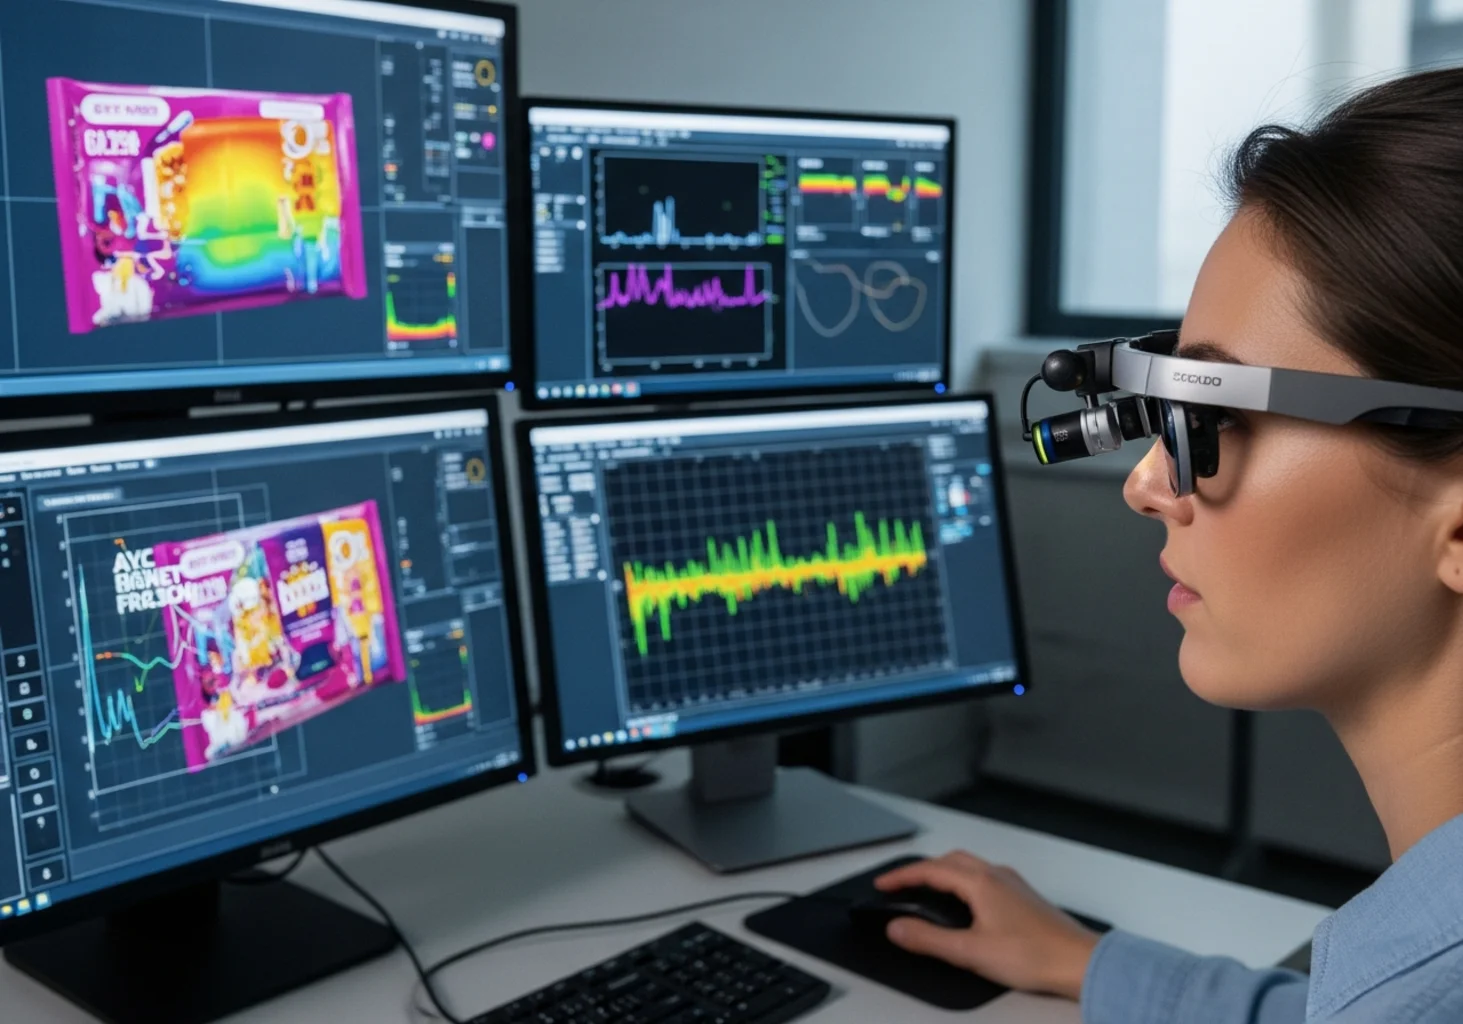
Your consumers can’t lie about where they look. The eye tracker proves it.
Eye tracking is a biometric research method that uses infrared sensors to record exactly where a person looks, for how long, and in what sequence — with millisecond precision and sub-degree accuracy. By mapping gaze patterns onto packaging, websites, advertisements, or shelf displays, eye tracking replaces subjective self-reports with objective visual-attention data. The result is a direct window into pre-conscious processing: what the brain notices before rational thought kicks in. Fieldstat operates both stationary screen-based trackers and mobile eye tracking glasses across Poland, delivering heat maps, gaze plots, and fixation analytics for UX, packaging, shopper, and advertising research.
How it works. An infrared sensor tracks corneal reflections to calculate the exact point of fixation with 0.5–1 degree accuracy — roughly a few millimetres on screen. The system records fixations (when the gaze rests on an element for 100–200ms), saccades (rapid eye movements between fixations), time to first fixation (how quickly an element is noticed), total fixation duration (cumulative attention), and revisits (return glances). These metrics generate two signature visualisations: heat maps (colour-coded attention density) and gaze plots (numbered eye-path diagrams showing the scanning sequence).
Two hardware formats. Stationary (screen-based) eye trackers mount beneath a monitor — the respondent views websites, ads, packaging mock-ups, or shelf planograms on screen. This format delivers the highest precision and is the standard for UX research, e-commerce, and packaging design studies. Mobile eye tracking glasses (wearable oculographs) enable research in natural environments — the respondent walks through a store, scans a display, or interacts with physical products. More expensive and slightly less precise, but irreplaceable for in-store and real-world context research.
The declaration-behaviour gap, visualised. A respondent says she pays attention to ingredient labels. The heat map shows her gaze never once landed on the nutrition table — it went straight to the price tag, then the brand logo, then the product image. This single finding can redirect an entire packaging redesign. Eye tracking doesn’t just supplement other methods — it corrects them.
Fieldstat’s eye tracking practice. We operate stationary and mobile eye tracking equipment across Poland. Typical projects involve 15–50 respondents, testing 3–8 stimuli (packaging variants, website layouts, ad creatives). We combine eye tracking with in-depth interviews (“why did you look there?”) and quantitative surveys for a complete picture: what they see, what they think, and what they do.
Sources: Tobii, ESOMAR, Fieldstat project benchmarks
| Application | Format | Key Metrics | Typical Sample |
|---|---|---|---|
Packaging design |
Stationary |
Time to logo, shelf visibility, element hierarchy |
20–30 respondents |
Website & app UX |
Stationary |
CTA visibility, navigation path, scroll depth |
15–25 respondents |
Advertising creative |
Stationary |
Brand notice time, visual flow, attention distribution |
20–40 respondents |
In-store shelf research |
Mobile glasses |
Category scan pattern, product pick-up triggers |
15–25 respondents |
Dashboard & interface |
Stationary |
Information hierarchy, error detection speed |
15–20 respondents |
Eye tracking measures what respondents actually see — not what they say they see. Millisecond-precision data eliminates declaration bias entirely.
Our visualisations are immediately understandable by any stakeholder — red means attention, blue means invisible. No statistical expertise required.
We operate both formats: screen-based trackers for digital and packaging research, wearable glasses for in-store and real-world environments.
We pair eye tracking with interviews and surveys to answer not just “where do they look?” but “why?” and “what does it mean for design?”
We define research questions, select the eye tracker format (stationary/mobile), and prepare stimuli (packaging variants, website builds, ad creatives).
We calibrate equipment for each respondent, ensuring measurement accuracy. For mobile studies, we set up the real-world environment (store, display).
Respondents view stimuli while the tracker records gaze data. We combine with post-exposure interviews to capture qualitative reasoning.
We generate heat maps, gaze plots, AOI (Area of Interest) statistics, and time-based attention metrics for each stimulus.
You receive visualised findings, attention scorecards, and evidence-based design recommendations. Delivered within 2 weeks of fieldwork.
For qualitative heat maps, 15–25 respondents produce stable attention patterns. For statistical comparison between stimuli variants, we recommend 30–50 respondents.
Projects start from PLN 8,000 for basic studies (15 respondents, 2–3 stimuli). Comprehensive projects (30–50 respondents, multiple stimuli, combined methodology) typically range PLN 20,000–50,000.
Yes — and it should be. We most commonly combine eye tracking with post-exposure interviews (“why did you look there?”) and quantitative surveys. This answers not just what they see, but why and what it means.
A heat map visualises gaze intensity using colour coding: red areas received the most attention, yellow moderate, blue minimal, and transparent areas were completely unnoticed. It’s the most intuitive way to evaluate whether key elements (logo, CTA, price) are actually seen.
Yes. Mobile eye tracking glasses allow respondents to shop naturally while we record exactly where they look. This captures real shelf scanning behaviour, category navigation, and product pick-up triggers.
Yes. We use both mobile eye tracking glasses and screen-integrated trackers for smartphone and tablet research. This enables natural-condition testing of app navigation, responsive websites, and mobile advertising.
Eye Tracking — Oculography (Wikipedia)
https://en.wikipedia.org/wiki/Eye_trackingTobii — Eye Tracking Technology
https://www.tobii.com/products/eye-trackersPTBRiO — Polish Market and Opinion Research Association
https://ptbrio.pl/